Table of Contents
Introduction to Top 3 Editor’s Choice Sections: Dashboards, Excel Templates & Utility Tools in VBA
Welcome to TheDataLabs.org‘s “Editor’s Choice” section – a comprehensive productivity toolbox that contains our top-performing articles and blog posts. We have handpicked these resources based on their exceptional visitor traffic and utility. This section comprises professionally crafted dashboards built with Power BI and Excel, which provide a visual overview of complex data sets. Additionally, we offer a range of free Excel templates such as Attendance Trackers, Time & Motion Trackers, Gantt Charts, Calendars, etc., which can be customized to suit your specific requirements.
Our Editor’s Choice section also features an array of utility tools created with VBA and Google Sheets, including Data Entry Forms, Automated Attendance Systems, Survey Forms, Project Management, Activity Management, Compliance Tools, Auto Email and many more. These tools are designed to streamline workflow, automate repetitive tasks, and improve productivity. Whether you are an individual or a business, our Editor’s Choice section has the tools to help you work smarter, not harder. So why wait? Explore our resources below and take the first step towards optimizing your workflow and staying organized.
Most Popular
- Create a Fully Automated Data Entry Userform in Excel and VBA
- How to Create a Multi-User Data Entry Form in Excel (Step-by-step Guide)
- Advance Data Entry Form
- Data Entry Application in Excel and Access
- Automated Student’s Registration Form in Excel and VBA
- Employee Activities Tracker
- Employee Activities Tracker version 2.0
- Data Entry Form
- Dynamic Gantt Chart in Excel
- Ultimate Excel Gantt Chart – Free Template
- Dynamic Customer Call Log Form in VBA
- Automated Data Collator in Excel
- Automated Student Mark Sheet
- Time and Motion Tracker
- How to make Login Form in Excel and VBA
- Transfer Data from Microsoft Excel to Google Sheet
- Automated Complaint Management System
- Call Center Audit Form in VBA & Excel
- Transfer Data from a Data Entry Form to a Protected Worksheet
- How to develop live currency converter in Excel?
- Create a SQL Query Executor Application in MS Excel and VBA
- Run UserForm without showing the Excel Application
- Master VBA: 5 Simple Steps to Send Email from Excel with Attachment and Image in Mail Body
- Develop a Dynamic Survey or Feedback Form in Excel and VBA – 3 easy steps
- Dynamic Sales Performance Dashboard in Excel with 5 and more Visuals
- Create Scrollable Table and Chart in MS Excel – No. 1 Trick
- Dynamic Employee Attendance Tracker in Excel with 2 Simple Steps Customization
- Time Tracking Sheet in Excel and VBA
- Customer Order Form in Google Sheet and Apps Script
- Automated Data Entry Form – Google Sheet
- Scrolling Chart in Excel
- Multi-Level Dependent Dynamic Drop-down Lists in Excel VBA
- How to display a progress bar with a user form in Excel
- UserForm Events in VBA
- Use Live Excel Charts as a Tooltip on Mouse Hover
- How to Show Help Pop-Up on Mouse Click
- Data Entry Form with Excel Table and VLOOKUP
- Interactive Chart on Mouse Hover
- Create a Dynamic Map Chart in any version of Excel
- Showing Multiple Lists in a Single ListBox Dynamically
- The Definitive Guide to Google Form
- Automated NSE Option Chain Data Extractor
- UserForm with Multiple Option Buttons in Excel and VBA
- Displaying Chart in a UserForm
- Animated Countdown Timer in Excel
- 3D Glass Fill Infographics
- Progressive Doughnut Chart
- 3D Infographics
- Optimize Your Leave Management with Dynamic Annual Leave Tracker in Excel and VBA
Dashboards
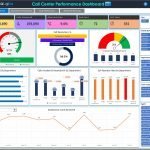
- Unlock Efficiency: Call Center Performance Dashboard in Excel (2024)
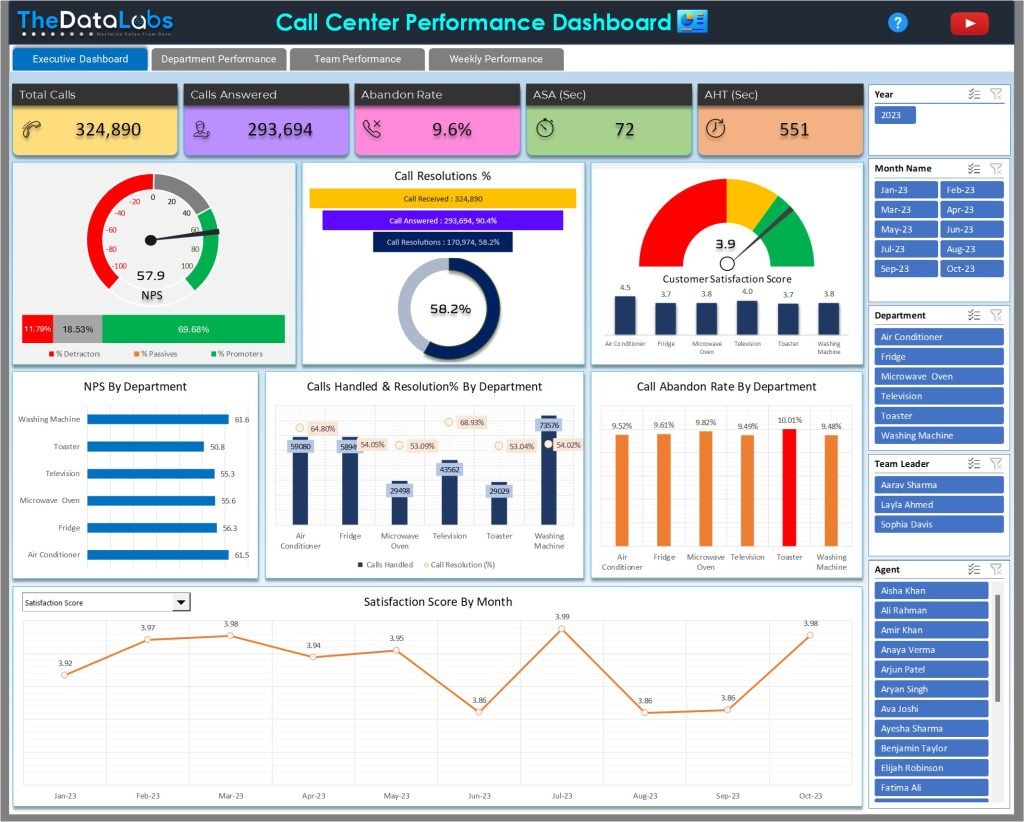 Introduction – Call Center Performance Dashboard in Excel Welcome to the dynamic world of customer service, where call centers play a crucial role in managing interactions and shaping the customer experience. In the journey to improve this essential function, organizations often rely on the Call Center KPI Performance Dashboard. This blog is your guide, walking… Read more: Unlock Efficiency: Call Center Performance Dashboard in Excel (2024)
 - Mastering Comparative Sales Analysis – Sales vs. Target Dashboard in Microsoft Excel with 3 Easy Steps
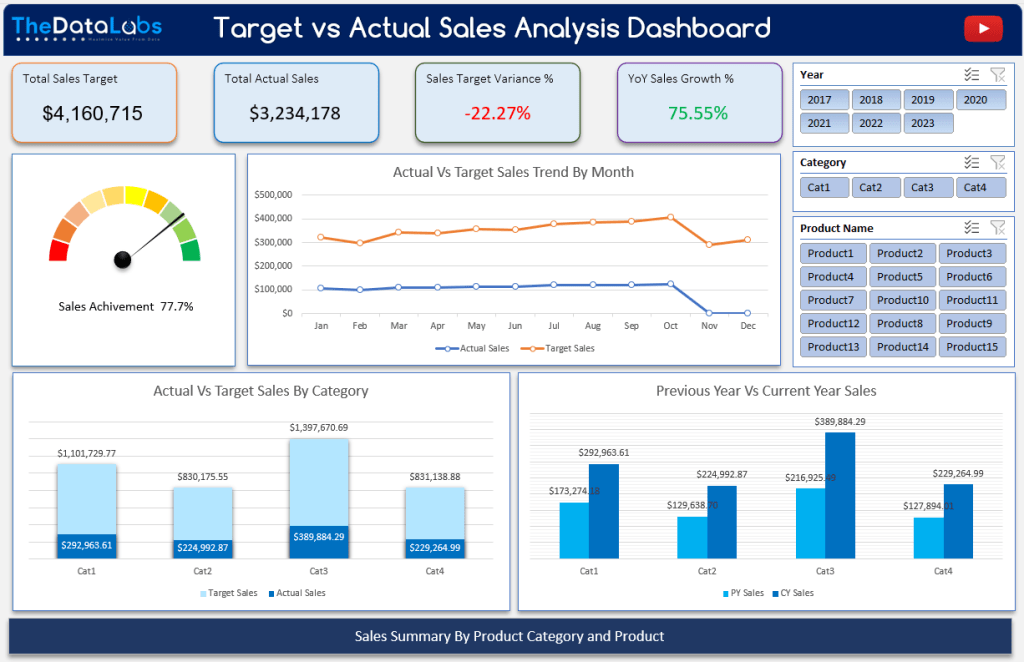 Introduction – Comparative Sales Analysis (Sales vs. Target Dashboard in Microsoft Excel) In the fast-paced world of business, staying ahead requires not just insights but actionable insights for the sales data. One powerful tool to achieve this is a Comparative Sales Analysis Dashboard. In this walkthrough, we’ll explore the systematic steps of creating an interactive… Read more: Mastering Comparative Sales Analysis – Sales vs. Target Dashboard in Microsoft Excel with 3 Easy Steps
 - Sales Dashboard in Power BI with 3 Steps – Dynamic and Interactive
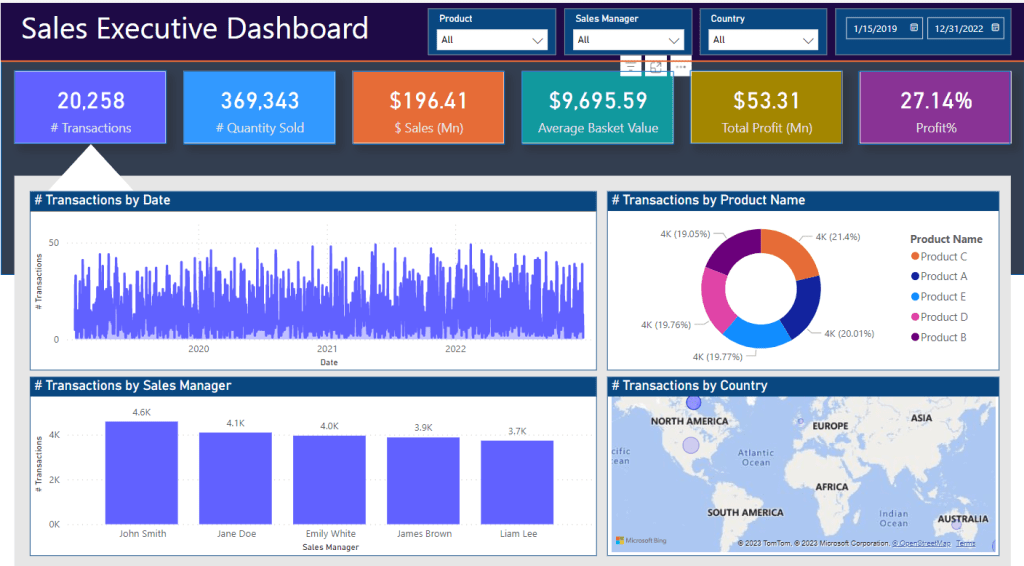 Introduction to Sales Dashboard in Power BI In this article, we will see the Sales Dashboard which has been developed in Power BI. This dashboard is one pager but due to dynamically changing the metrics on selection, it will act like it has multiple pages providing performance summary of several KPIs. What is Sales Dashboard?… Read more: Sales Dashboard in Power BI with 3 Steps – Dynamic and Interactive
 - Dynamic Sales Performance Dashboard in Excel with 5 and more Visuals
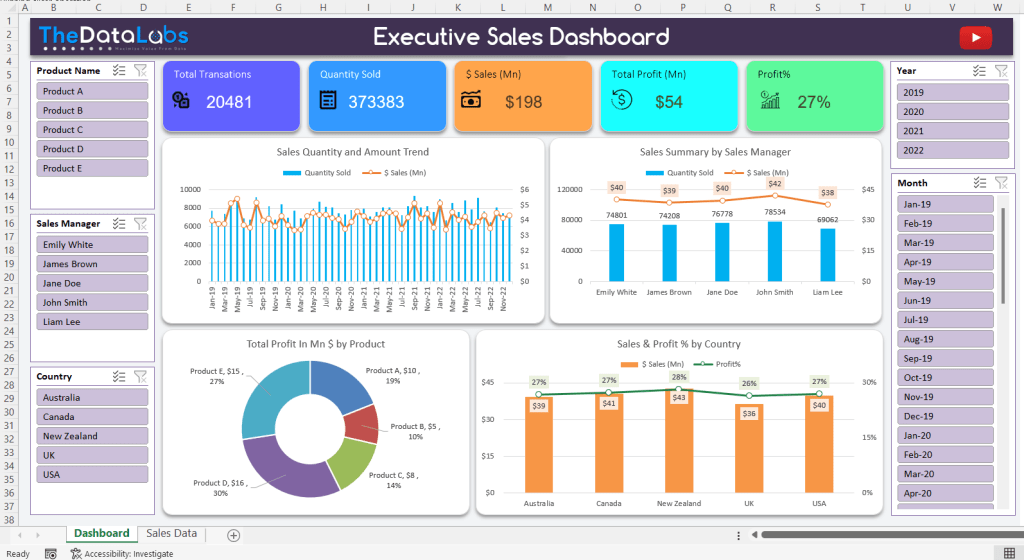 Introduction the Sales Performance Dashboard A Sales Performance Dashboard is a visual representation of sales data that helps businesses monitor their sales performance and identify trends and patterns. Sales teams can use this dashboard to track key performance indicators, identify areas that require attention, and make data-driven decisions to improve their sales strategies on time.… Read more: Dynamic Sales Performance Dashboard in Excel with 5 and more Visuals
Excel Templates
- Ultimate To-Do List & Daily Activity Tracker in Excel – 2024
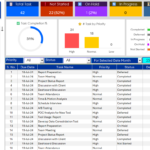 Introduction to the Ultimate To-Do List & Daily Activity Tracker in Excel In today’s busy world, keeping track of daily tasks and activities is essential for staying organized and meeting deadlines. That’s why we’ve created the Ultimate To-Do List & Daily Activity Tracker in Excel and VBA – a tool designed by TheDataLabs professionals to… Read more: Ultimate To-Do List & Daily Activity Tracker in Excel – 2024
 - Unlock Efficiency: Call Center Performance Dashboard in Excel (2024)
 Introduction – Call Center Performance Dashboard in Excel Welcome to the dynamic world of customer service, where call centers play a crucial role in managing interactions and shaping the customer experience. In the journey to improve this essential function, organizations often rely on the Call Center KPI Performance Dashboard. This blog is your guide, walking… Read more: Unlock Efficiency: Call Center Performance Dashboard in Excel (2024)
 - Mastering Comparative Sales Analysis – Sales vs. Target Dashboard in Microsoft Excel with 3 Easy Steps
 Introduction – Comparative Sales Analysis (Sales vs. Target Dashboard in Microsoft Excel) In the fast-paced world of business, staying ahead requires not just insights but actionable insights for the sales data. One powerful tool to achieve this is a Comparative Sales Analysis Dashboard. In this walkthrough, we’ll explore the systematic steps of creating an interactive… Read more: Mastering Comparative Sales Analysis – Sales vs. Target Dashboard in Microsoft Excel with 3 Easy Steps
 - Automated Daily Activity Tracker in Excel: Ultimate Task Management (2024)
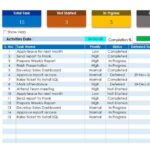 Introduction to Automated Daily Activity Tracker in Excel Keeping track of our daily activities or to-do lists efficiently is crucial for staying organized and meeting deadlines. In today’s fast-paced world, managing our tasks can sometimes be a challenge. However, with the right tools and software, this process can become much simpler and easier to manage.… Read more: Automated Daily Activity Tracker in Excel: Ultimate Task Management (2024)
 - Sales Dashboard in Power BI with 3 Steps – Dynamic and Interactive
 Introduction to Sales Dashboard in Power BI In this article, we will see the Sales Dashboard which has been developed in Power BI. This dashboard is one pager but due to dynamically changing the metrics on selection, it will act like it has multiple pages providing performance summary of several KPIs. What is Sales Dashboard?… Read more: Sales Dashboard in Power BI with 3 Steps – Dynamic and Interactive
Utility Tools in VBA
- Ultimate To-Do List & Daily Activity Tracker in Excel – 2024Introduction to the Ultimate To-Do List & Daily Activity Tracker in Excel In today’s busy world, keeping track of daily tasks and activities is essential for staying organized and meeting deadlines. That’s why we’ve created the Ultimate To-Do List & Daily Activity Tracker in Excel and VBA – a tool designed by TheDataLabs professionals to… Read more: Ultimate To-Do List & Daily Activity Tracker in Excel – 2024
- Automated Daily Activity Tracker in Excel: Ultimate Task Management (2024)Introduction to Automated Daily Activity Tracker in Excel Keeping track of our daily activities or to-do lists efficiently is crucial for staying organized and meeting deadlines. In today’s fast-paced world, managing our tasks can sometimes be a challenge. However, with the right tools and software, this process can become much simpler and easier to manage.… Read more: Automated Daily Activity Tracker in Excel: Ultimate Task Management (2024)
- Dynamic Employee Attendance Tracker in Excel with 2 Simple Steps Customization
 Introduction to Dynamic Employee Attendance Tracker in Excel Microsoft Excel is a powerful and versatile tool that can be used to create an attendance tracker, a tool commonly used by organizations, teams, or groups to monitor and track the attendance of their employees or members. Attendance tracking is crucial as it enables companies to keep… Read more: Dynamic Employee Attendance Tracker in Excel with 2 Simple Steps Customization
 - Develop a Dynamic Survey or Feedback Form in Excel and VBA – 3 easy steps
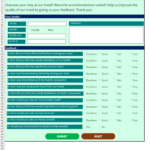 In this tutorial, you will learn how to create a customer survey or feedback form in Excel and VBA. Customer feedback is a vital aspect of any business, and with this form, you can collect valuable data to improve customer satisfaction. Whether you are new to Excel or VBA, this step-by-step guide will help you create a beautiful and automated form that you can use for any business. Download the sample file and get started today!
 - Master VBA: 5 Simple Steps to Send Email from Excel with Attachment and Image in Mail Body
 VBA to Send Email from Excel with Attachment and Image in Mail Body Create Excel file and design the ‘Home’ page and user email list table Open VBA window and insert blank module Write VBA code to send automated emails Attach an Excel file to the email Show image in mail body without losing the reference (using content id) HTML to create the mail body
We hope you found this Editor’s choice list of articles helpful. Please check our Home page for more details related to Free Excel Templates, Utility Tools in VBA and Google Apps Script, and Dashboards in MS Excel and Power BI. Thanks!


")
