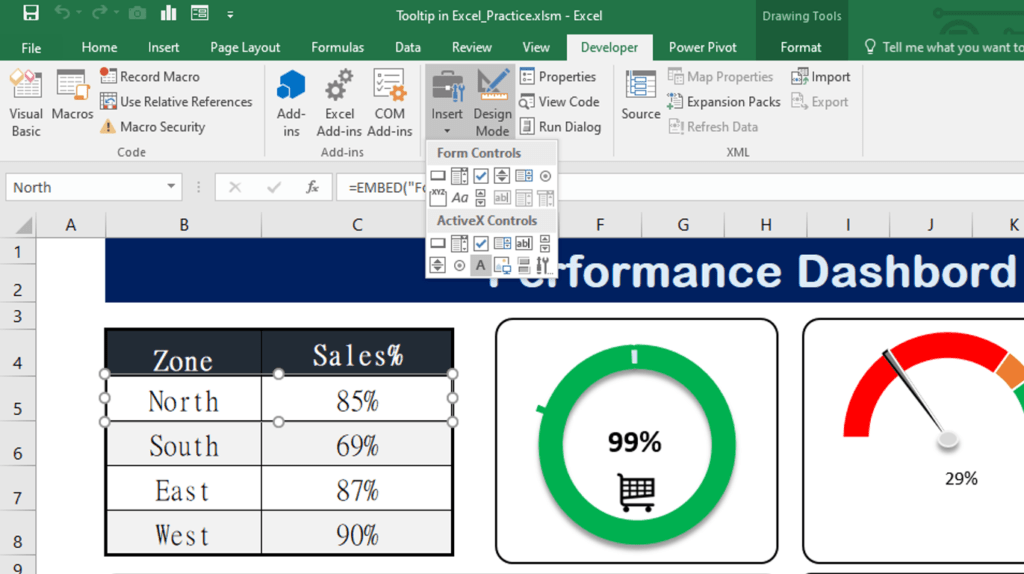
In this post, we will learn how to create a custom tooltip in Excel and show a live chart on mouse hover. This is inbuilt feature in Power BI and it’s very useful and interactive way to show the extended data. We will try to replicate this feature in Excel with the help of VBA code.
Open the demo file (you can download from the button available at the bottom of the page).
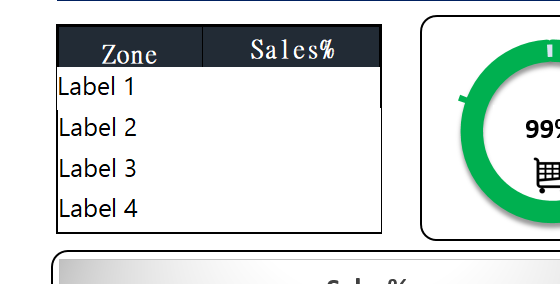
Insert 5 different labels.
Four different labels are for North, South, East and West and 1 is for Overall. Remove the caption, make it transparent. Change the name to North, South, East, West and Overall. Overall labels should overlap the entire table including some surrounding space and 4 others labels for zone should cover all Zone and Sales% respectively.
Move to Visual Basic application and write the below in code window of sheet “Dashboard”.
Private Sub lblNorth_MouseMove(ByVal Button As Integer, ByVal Shift As Integer, ByVal X As Single, ByVal Y As Single)

    ThisWorkbook.Sheets("Raw Data 3").Range("A10").Value = "North"

    ThisWorkbook.Sheets("Dashboard").Shapes("ToolTip").Top = ThisWorkbook.Sheets("Dashboard").Range("D5").Top
    ThisWorkbook.Sheets("Dashboard").Shapes("ToolTip").Left = ThisWorkbook.Sheets("Dashboard").Range("D5").Left
    ThisWorkbook.Sheets("Dashboard").Shapes("ToolTip").Visible = True

End Sub


Private Sub lblOverall_MouseMove(ByVal Button As Integer, ByVal Shift As Integer, ByVal X As Single, ByVal Y As Single)
    ThisWorkbook.Sheets("Dashboard").Shapes("ToolTip").Visible = False
End Sub

Private Sub lblSouth_MouseMove(ByVal Button As Integer, ByVal Shift As Integer, ByVal X As Single, ByVal Y As Single)

    ThisWorkbook.Sheets("Raw Data 3").Range("A10").Value = "South"

    ThisWorkbook.Sheets("Dashboard").Shapes("ToolTip").Top = ThisWorkbook.Sheets("Dashboard").Range("D6").Top
    ThisWorkbook.Sheets("Dashboard").Shapes("ToolTip").Left = ThisWorkbook.Sheets("Dashboard").Range("D6").Left
    ThisWorkbook.Sheets("Dashboard").Shapes("ToolTip").Visible = True

End Sub

Private Sub lblEast_MouseMove(ByVal Button As Integer, ByVal Shift As Integer, ByVal X As Single, ByVal Y As Single)

    ThisWorkbook.Sheets("Raw Data 3").Range("A10").Value = "East"

    ThisWorkbook.Sheets("Dashboard").Shapes("ToolTip").Top = ThisWorkbook.Sheets("Dashboard").Range("D7").Top
    ThisWorkbook.Sheets("Dashboard").Shapes("ToolTip").Left = ThisWorkbook.Sheets("Dashboard").Range("D7").Left
    ThisWorkbook.Sheets("Dashboard").Shapes("ToolTip").Visible = True

End Sub


Private Sub lblWest_MouseMove(ByVal Button As Integer, ByVal Shift As Integer, ByVal X As Single, ByVal Y As Single)

    ThisWorkbook.Sheets("Raw Data 3").Range("A10").Value = "West"

    ThisWorkbook.Sheets("Dashboard").Shapes("ToolTip").Top = ThisWorkbook.Sheets("Dashboard").Range("D8").Top
    ThisWorkbook.Sheets("Dashboard").Shapes("ToolTip").Left = ThisWorkbook.Sheets("Dashboard").Range("D8").Left
    ThisWorkbook.Sheets("Dashboard").Shapes("ToolTip").Visible = True

End Sub
Please watch the step by step tutorial on YouTube.
Click on below button to download the Excel file used in this tutorial.