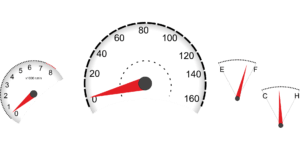
The term dashboard originates from the automobile dashboard where drivers monitor the major functions at a glance via the instrument cluster. It provides all the critical information needed to operate the vehicle at a glance.
In the same way, if we talk about BI Dashboard then we refer a single-screen display where all the required visuals and performance graphs are available so that management can get the key information about the business performance and take the decisions. Let’s go through the proper definition and usage of Dashboard.
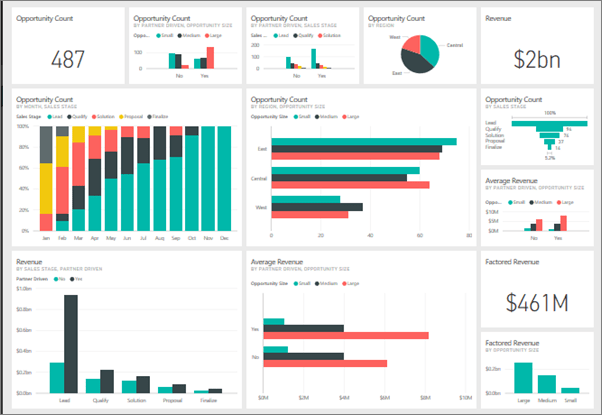
A Dashboard is an information management tool that often provide at-a-glance views of key performance indicators (KPI), metrics and key data points to monitor the health of a business, department or specific process. They are customizable to meet the specific requirement of a function, department and company. In the other, “dashboard” has another name for “progress report” or “report”.
For example, a manufacturing dashboard may show numbers related to productivity such as number of parts manufactured, or number of failed quality inspections per hour. Similarly, a human resources dashboard may show numbers related to staff recruitment, retention and composition, for example number of open positions, or average days or cost per recruitment.
According to Dashboard and Visualization guru Stephen Few
A dashboard is a visual display of the most important information needed to achieve one or more objectives, consolidated and arranged on a single screen so the information can be monitored at a glance.
Classification of Dashboard
Dashboards can be broken down according to role and are either strategic, analytical, operational, or informational.
Strategic dashboards support managers at any level in an organization, and provide the quick overview that decision makers need to monitor the health and opportunities of the business. Dashboards of this type focus on high level measures of performance, and forecasts. Strategic dashboards benefit from static snapshots of data (daily, weekly, monthly, and quarterly) that are not constantly changing from one moment to the next.
Dashboards for analytical purposes often include more context, comparisons, and history, along with subtler performance evaluators. Analytical dashboards typically support interactions with the data, such as drilling down into the underlying details.
Dashboards for monitoring operations are often designed differently from those that support strategic decision making or data analysis and often require monitoring of activities and events that are constantly changing and might require attention and response at a moment’s notice.
Types of Dashboard
There are three main types of digital dashboard dominate the market today: Stand alone Software applications, Web-browser based applications, and desktop applications also known as desktop widgets. The last are driven by a widget engine.
Specialized dashboards may track all corporate functions. Examples include human resources, recruiting, sales, operations, security, information technology, project management, customer relationship management and many more departmental dashboards. For a smaller organization like a startup a compact startup scorecard dashboard tracks important activities across lot of domains ranging from social media to sales.
Digital dashboard projects involve business units as the driver and the information technology department as the enabler. The success of digital dashboard projects often depends on the metrics that were chosen for monitoring. Key performance indicators, balanced scorecards, and sales performance figures are some of the content appropriate on business dashboards.


