Brief explanation of Insert tab
As the name suggests, the Insert menu helps you insert various options and items into an Excel spreadsheet. You can insert a variety of things ranging from pivot table to picture, clip art, shapes, screen shots, charts and graphs, text box, header and footer, symbols, equation, and more.
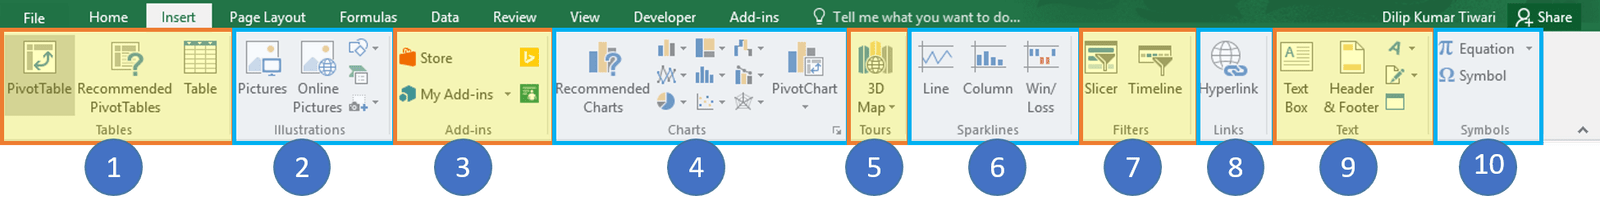
- Tables – This group provides a superior way to organize the data. You can use Table to filter and format the data within the sheet. In addition, you can also use Pivot Tables to analyze complex data very easily.
- Illustrations – This group provides a way to insert pictures, shapes or art work into excel. You can insert the pictures either directly from the computer or you can also use Online Picture Option to search for relevant pictures. In addition, shapes provide additional ready made square, circle, arrow kind of shapes that can be used in excel. SmartArt provides an awesome graphical representation to visually communicate data in the form of List, organizational charts, venn diagram to process diagrams. Screenshot can be used to quickly insert a screenshot of any program that is open on the computer.
- Add-ins – You can use this group to add Add-ins which you developed. You can also purchase add-ins from the Store section. Bing Maps app allows you to use the location data from a given column and plot it on Bing Maps. Also there is new feature called Transfer cold data into cool pictures.
- Charts – This is one of the most useful features in Excel. It helps you visualize the data in graphical format with several inbuilt graphs and visualizations. Recommended charts allow Excel to come up with the best possible graphical combination. In addition, you can make graphs on your own and excel provides various options like Pie-chart, Line Chart, Column Chart, Bubble Chart, combo chart, Radar Chart, and Pivot Charts.
- 3D Maps – Microsoft 3D Maps for Excel is a three-dimensional (3-D) data visualization tool that lets you look at information in new ways. 3D Maps lets you discover insights you might not see in traditional two-dimensional (2-D) tables and charts.
With 3D Maps, you can plot geographic and temporal data on a 3-D globe or custom map, show it over time, and create visual tours you can share with other people. - Sparklines – Sparklines are mini charts that are made on the number data and can be displayed with this cells. There are different options available for sparklines like Line Sparkline, Column Sparkline and Win/Loss Sparkline.
- Filters – There are two types of filters available – Slicer allows you to filter the data visually and can be used to filter tables, pivot tables data etc. Timeline filter allows you to filter the dates interactively.
- Hyperlink – This is a great tool to provide hyperlinks from the excel sheet to an external URL or files. Hyperlinks can also be used to create a navigation structure with the excel sheet that is easy to use.
- Text – This group is used to text in the desired format. For example, if you want to have the header and footer, you can use this group. In addition, wordart allows you to use different styling for text. You can also create your signature using the Signature line feature.
- Symbols – This primarily consists of two parts – a) Equation – this allows you to write mathematical equations that we cannot ordinarily write in Excel sheet. 2) Symbols are special character or symbols that we may want to insert in the excel sheet for better representation.
![]()
![]()

")


