Table of Contents
Ultimate Excel Gantt Chart with Pending, In Progress and Completed
Gantt Chart is one of the best tools to manage, track and visualize the progress of any ongoing project. It helps the project manager to highlight Pending, In Progress and Completed status of any of the task or sub-task related to a project. It also provides the drill-down view of Completed task with Delayed, Actual (In Time) and Extended time.
Availability of Project Management (Gantt Chart) tool
You can find several professional tools to manage your project but all these Project Management tools are very costly. Most of the time, we are looking for the tool to visualize the progress of a project with Gantt chart. Selecting a tool or software to create a Gantt Chart is not the wisest decision in these scenarios.
To save the software cost, we can utilize the most versatile tool, Excel for creating a Dynamic Project Plan (Gantt Chart). Excel provides all the functionalities to create ultimate Excel Gantt Chart with all the required functionalities. You can show the overall status of project e.g. Pending, In Progress and Completed. Also, you can highlight the Delayed, On Time and Extended time period for a completed task or sub-task.
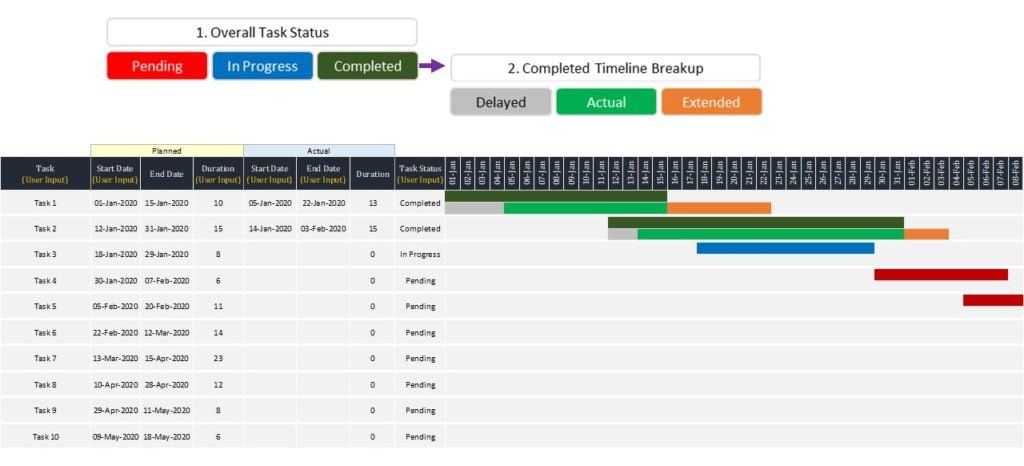
Snapshot of Ultimate Excel Gantt Chart with Pending, In Progress and Completed Status
Features of Ultimate Excel Gantt Chart
In this Ultimate Excel Gantt Chart, there are several features.
Project Plan (Gantt chart) has been developed in Microsoft Excel. Here, Excel cells have been utilized to create this. There is no use of any Excel Chart or complex formulas to create this Project Plan. This Gantt Chart is really a robust chart and can be used in Project Management Dashboard or Business presentations. We have used conditional formatting and some coding to highlight the task status this project plan.
Two types of status are available –
- Overall Task Status
- Completed Timeline Breakups
Overall Task Status has three different status 1. Pending, 2. In Progress and 3. Completed. All these status have been highlighted with different colors. Color for Pending is Red, In Progress is Blue and Completed is Dark Green.
Completed task has been further segregated into three status in next row for the same task. It will help you in identifying the delays, on time and extended days of a completed task. Here, we have taken 3 different status with color highlight options. Any delay in task has been considered as Delayed and highlighted with Gray; Actual has been denoted with Light Green and Extended has been visualized with Orange color.
Apart from the above-mentioned features, it has feasibilities to exclude holidays while calculating Planned End Date basis on Planned Start Date and Planned Duration. Excel formulas will automatically calculate the Planned End Date and ignore all the dates which are falling between the given duration. We are utilizing WORKDAY function to calculate the Planned End Date.
Excel functions used in Ultimate Excel Gantt Chart

=WORKDAY(B9,D9,Holidays!$A$4:$A$1048576)To calculate the Actual Duration in this Gantt Chart, we have used NETWORKDAYS function. It excludes the Holidays while calculating the total workings days falling between two given date range e.g. Actual Start Date and Actual End Date.
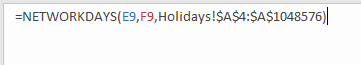
=NETWORKDAYS(E9,F9,Holidays!$A$4:$A$1048576)To show the overall status of a task, we have used nested if function with color coding name for Conditional Formatting. Here, we have used “R” for Pending, “P” for In Progress and “C” for Completed.
Please see the below formulas used to identify the color coding for overall status of a task or sub-task in Gantt Chart.

=IF(AND(I$8>=$B9,I$8<=$C9,$H9="Pending"),"R",IF(AND(I$8>=$B9,I$8<=$C9,$H9="In Progress"),"P",IF(AND(I$8>=$B9,I$8<=$C9,$H9="Completed"),"C","")))To highlight the Completed Timeline of a task or sub-task in Gantt Chart, we have used another Nested If function in Excel function with color coding name for Conditional Formatting. Here, we have used “D” for Delayed, “A” for Actual “E” for Extended days.
Below formulas have been used to identify the color coding for Completed Timeline in Gantt Chart.

=IF(AND(I$8<$E9,I$8>=$B9,$H9=”Completed”),”D”, IF(AND(I$8>$C9,I$8<=$F9,$H9=”Completed”),”E”, IF(AND(I$8>=$B9,I$8<=$C9,$H9=”Completed”), “A”,””)))
YouTube Tutorial for Ultimate Excel Gantt Chart
Watch our YouTube tutorial to learn how to create this dynamic Gantt Chart with Pending, In Progress and Completed status.
Download Gantt Chart
To know more about the Gantt Chart, please visit the Wikipedia page.


