Table of Contents
Introduction – Create Scrollable Table and Chart in MS Excel
When it comes to creating reports and dashboards, presenting a large volume of data in a table or chart can be a challenge. Either we have to allot a lot of space for these visuals, or if we keep them in a small area, the information can become difficult to read or cluttered. But fret not! In this blog, I’ll teach you how to create a scrollable chart and table in MS Excel using simple techniques, without the need for VBA code or advanced Excel functions. This will help you present your data in a more concise and organized way.
How to Create Scrollable Charts and Tables in Excel:
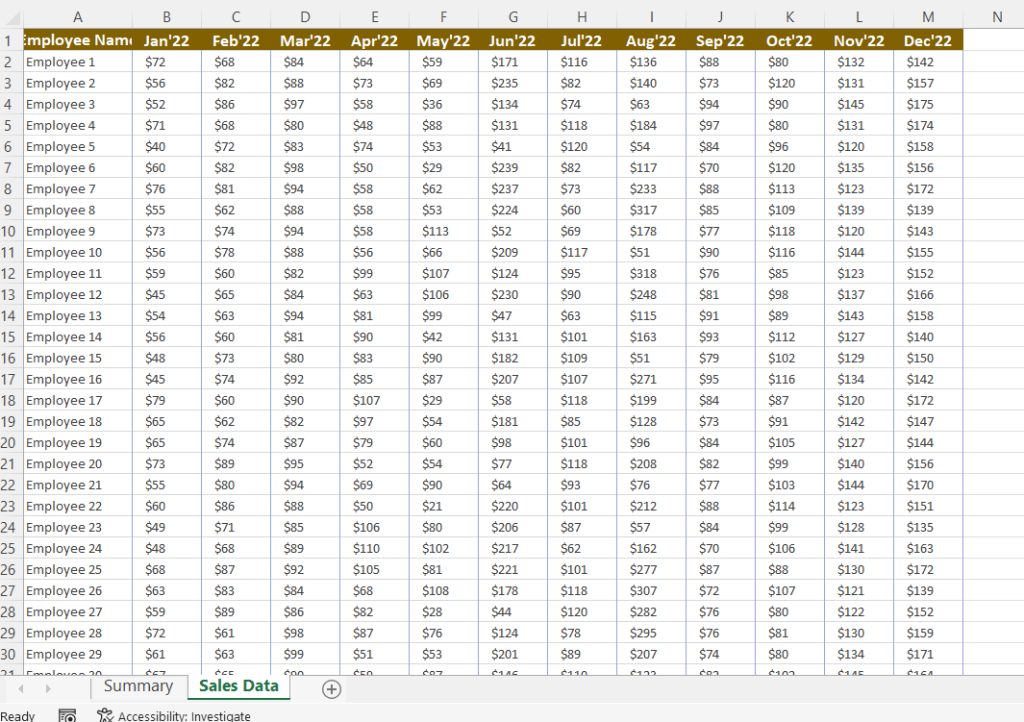
In this method, we will be utilizing a sample sales data file with two worksheets: the Summary sheet and the Sales Data sheet.
On the Sales Data sheet, we have a table with sales data for 100 employees for last 1 year starting from Jan’22 to Dec’22. It has sales data for 100 employees.
In the Summary sheet, we will present the scrollable table and chart. By making use of the scroll features, we’ll only display 10 records at a time in both the chart and table. To enable scrolling through the data, we’ll add two scrollbars at the top and right side of the table. In addition, we’ll create a chart that is based on the summarized data, which updates as we scroll through the table.
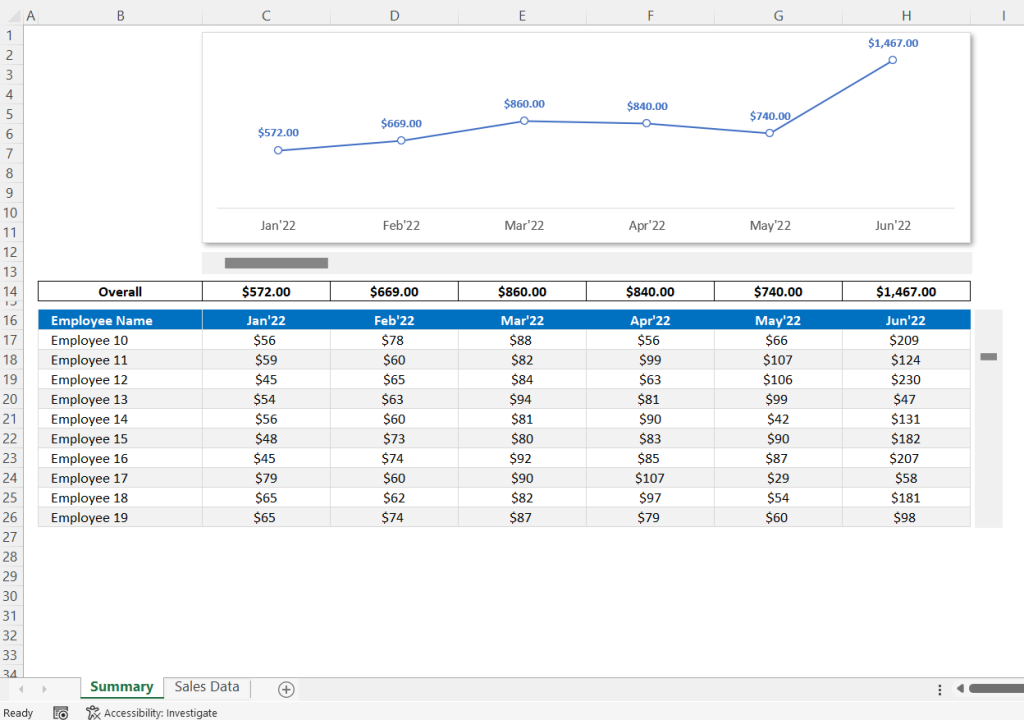
Using this technique, we can present vast amounts of data in a concise and structured manner. Therefore, get prepared to enhance your data presentation with this user-friendly approach and elevate the quality of your reports or dashboards!
Step-by-step YouTube Tutorial
Please watch our step-by-step tutorial to learn how to create scrollable table and chart in Excel. We have explained all the steps in easy and simple way.
Download the Excel File
Please download the demo file from the below link.

If you have any questions about this tutorial, please leave a comment and TheDataLabs team will respond to you as soon as possible.
Visit our Template Store to buy Premium Templates, Dashboards and Trackers in MS Excel, VBA and Power BI. Thanks!


