Introduction: Scrolling Chart in Excel
We use MS Excel on a daily basis for several tasks, e.g., data analysis, automation, data cleaning, and data visualization. In data visualization or dashboard development, one thought always pops into mind: is it possible to make charts animated and dynamic to enhance engagement and data insights? The answer is yes—we can create a scrollable chart in Excel with the help of VBA.
In this tutorial, we will learn how to create an animating or scrolling chart in Excel and VBA. This is a supporting blog for the YouTube tutorial we have posted on our channel. Also, we have provided the practice file at the end of the blog. You can download it and practice to get a better understanding.
Step-by-step process to create a scrolling chart in Excel.
- Create a new Excel file and save it with the name ‘Scrolling Chart.xlsm’. Ensure you select .xlsm as the file type while saving; otherwise, the macro will not work.
- Rename Sheet1 as ‘Sales Data’.
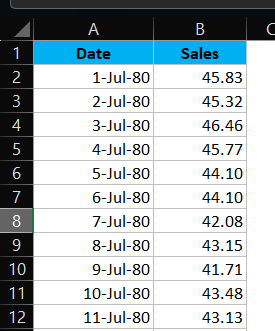
- Copy the sales data available in columns A and B from the practice file you have downloaded (if not downloaded, you can download it using the link provided at the end of this post).
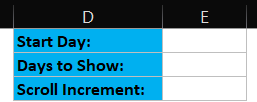
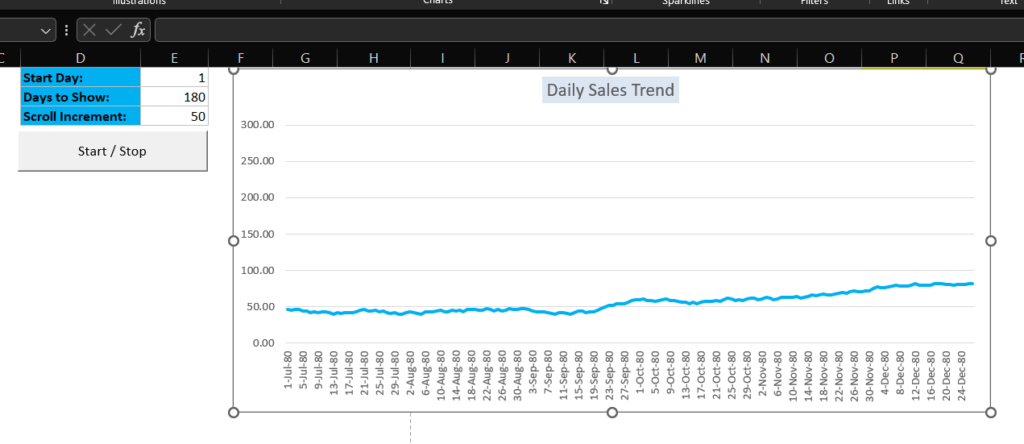
- Create a parameter table in columns D and E. Enter ‘Start Day:’ in D1, ‘Days to Show:’ in D2, and ‘Scroll Increment:’ in D3. Leave the corresponding cells in column E blank.
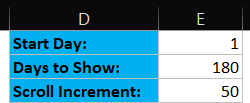
- Let’s update the initial values in column E for all the parameters. The value for ‘Start Day’ will be 1, ‘Days to Show’ will be 180, and ‘Scroll Increment’ will be 50. The logic is that the chart will start from the 1st day of the data in column A and display 180 days of data in the chart. When we animate the chart, it will move the days by 50, so the chart will update accordingly.
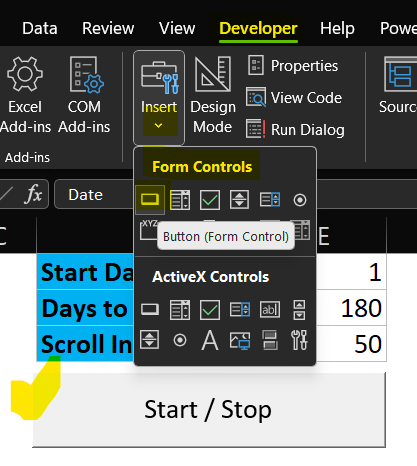
- Insert a Form Control button so that the user can click on it to start and stop the animation. To insert it, go to the Developer tab, click on “Button” under Form Controls, and place it below the table. Name it ‘Start/Stop’.
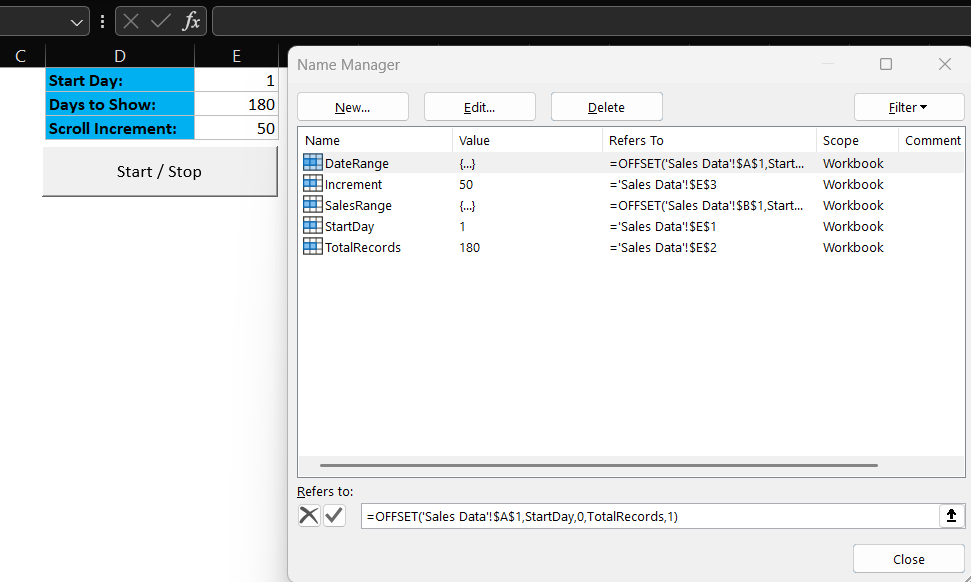
- Let’s create named ranges. Below are the names and formulas required for ‘Name’ and ‘Refers To’ in the Name Manager window. To open the Name Manager, use the shortcut key CTRL + F3.
| Name | Refers To |
|---|---|
| DateRange | =OFFSET(‘Sales Data’!$A$1,StartDay,0,TotalRecords,1) |
| Increment | =’Sales Data’!$E$3 |
| SalesRange | =OFFSET(‘Sales Data’!$B$1,StartDay,0,TotalRecords,1) |
| StartDay | =’Sales Data’!$E$1 |
| TotalRecords | =’Sales Data’!$E$2 |
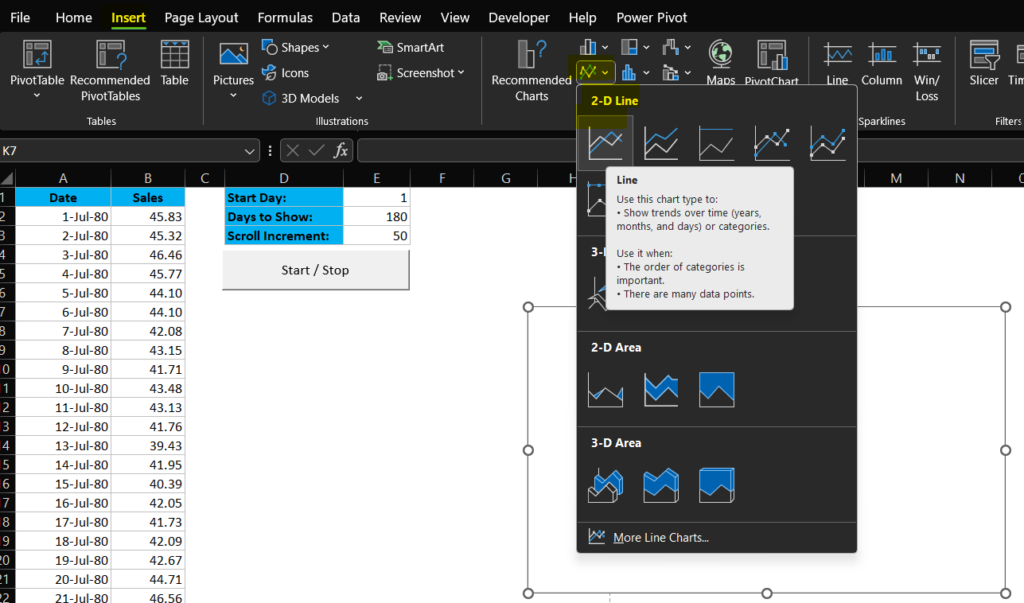
- Insert a 2D line chart in this sheet. To insert a chart, click on the Insert tab, and under the Charts section, click on 2-D Line, then select the line chart (the first one).
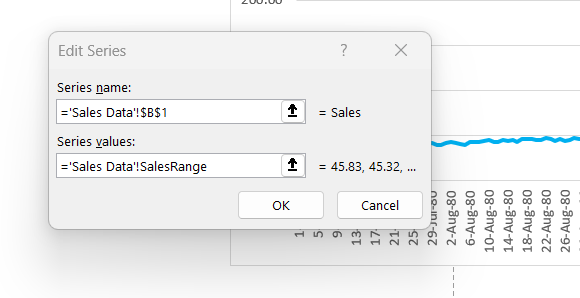
- Assign the source of the chart. To do that, right-click on the chart and click on Select Data. It will open the Select Data Source window. Click on Add in Legend Entries (Series) and give the reference of B1 in Series name, and in Series values, give the reference of the named range we created as ‘NamedRange’. Now, click on the OK button. It will insert the chart.
- Make the required changes in the formatting of the chart. Your chart will look like this.
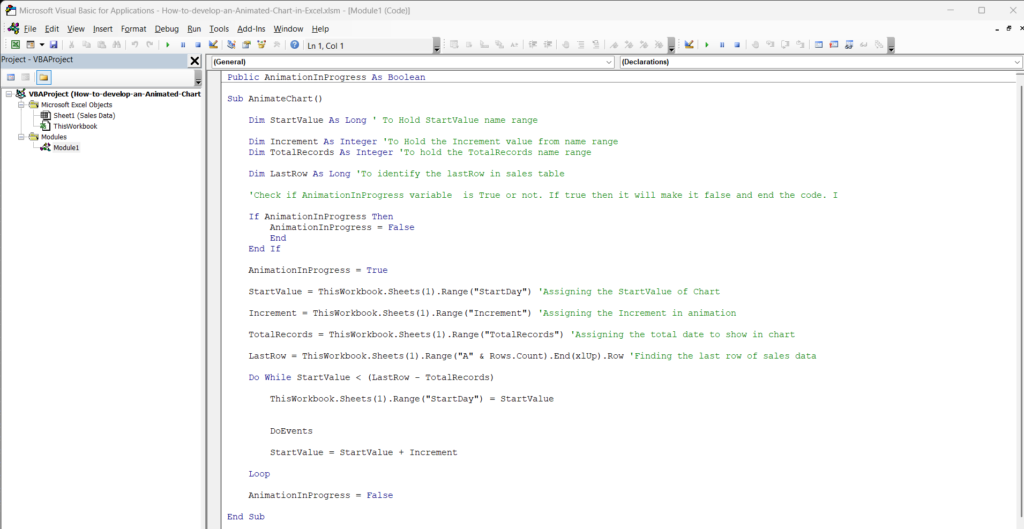
- To animate this chart, we need to write VBA code. Press ALT + F11 to open the Microsoft Visual Basic for Applications window, and insert a blank module. To do that, click on the Insert menu and then Module. This will insert a blank module. Now, in the module window, we need to write code to animate the chart. You can copy the Sub Procedure below and paste it there.
Public AnimationInProgress As Boolean

Sub AnimateChart()

    Dim StartValue As Long ' To Hold StartValue name range

    Dim Increment As Integer 'To Hold the Increment value from name range
    Dim TotalRecords As Integer 'To hold the TotalRecords name range

    Dim LastRow As Long 'To identify the lastRow in sales table

    'Check if AnimationInProgress variable  is True or not. If true then it will make it false and end the code. I

    If AnimationInProgress Then
        AnimationInProgress = False
        End
    End If

    AnimationInProgress = True

    StartValue = ThisWorkbook.Sheets(1).Range("StartDay") 'Assigning the StartValue of Chart

    Increment = ThisWorkbook.Sheets(1).Range("Increment") 'Assigning the Increment in animation

    TotalRecords = ThisWorkbook.Sheets(1).Range("TotalRecords") 'Assigning the total date to show in chart

    LastRow = ThisWorkbook.Sheets(1).Range("A" & Rows.Count).End(xlUp).Row 'Finding the last row of sales data

    Do While StartValue < (LastRow - TotalRecords)

        ThisWorkbook.Sheets(1).Range("StartDay") = StartValue


        DoEvents

        StartValue = StartValue + Increment

    Loop

    AnimationInProgress = False

End Sub
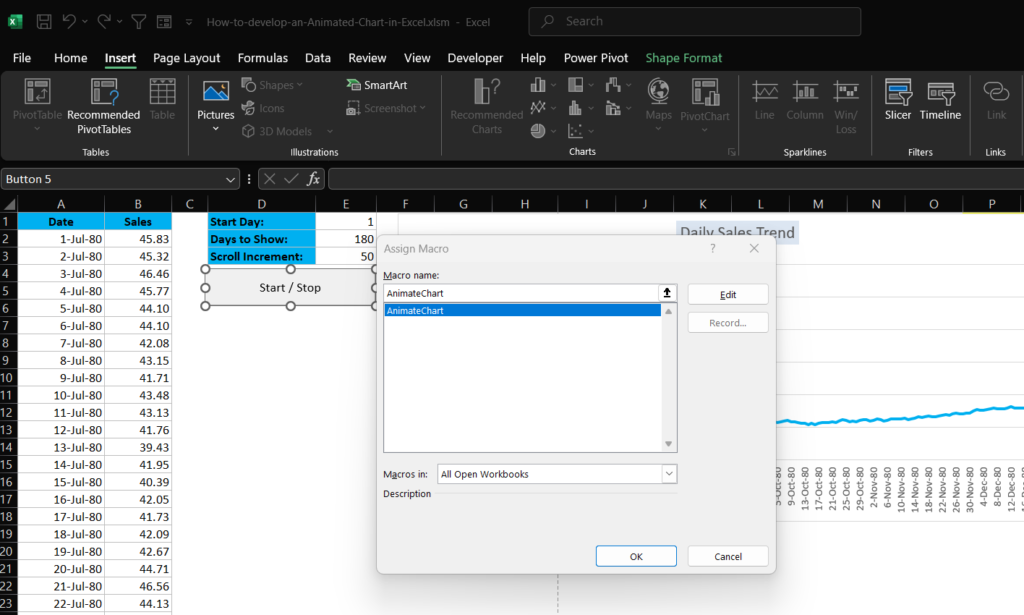
- Now, move to the Excel window and assign the Sub Procedure ‘AnimateChart’ to the ‘Start/Stop’ button. To do that, right-click on the ‘Start/Stop’ button, then click on Assign Macro, and in the Assign Macro window, select AnimateChart, and then click on OK.
After following the above steps, you are done with creating a scrolling chart in Excel. Using the same logic, you can animate any chart. You just need to play with the required parameters of the chart and change the value of the parameters using VBA.
Watch our YouTube tutorial to learn how to create a scrolling chart in Excel.
Download link for the practice file of the scrolling chart in Excel.
Please download the demo file of scrolling chart in Excel along with the code by clicking the button below.

Please post your comment if you have any feedback or questions.


